
The Scaling Wall: When Good Queries Go Bad
In high-throughput software architectures, the database is almost always the ultimate bottleneck. Unlike stateless API gateways or containerized worker pools that scale horizontally with a Kubernetes replica increment, relational databases maintain ACID transaction guarantees and disk synchronization invariants that require deliberate engineering.
When a query that once took 4 milliseconds under development suddenly degrades to 1,800 milliseconds in production under 15,000 concurrent users, the failure is rarely random. It is rooted in how PostgreSQL coordinates disk blocks, manages its shared buffer pool, tracks tuple visibility through Multi-Version Concurrency Control (MVCC), and allocates memory across client connections.
+-----------------------------------------------------------------------------------+| POSTGRESQL MEMORY ARCHITECTURE |+-----------------------------------------------------------------------------------+| || [Shared Memory Area] || +---------------------------+ +----------------------+ +--------------------+ || | shared_buffers | | WAL Buffers | | CLOG Buffers | || | (Cached 8KB Data Pages) | | (Write-Ahead Log) | | (Commit Logs/XMIN) | || +---------------------------+ +----------------------+ +--------------------+ || ^ | | |+---------------|----------------------------|------------------------|-------------+ | Read / Dirty Pages | fsync() to disk | Checkpoint+---------------v----------------------------v------------------------v-------------+| [Kernel Page Cache & Physical NVMe SSD Storage] || +-----------------------------------------------------------------------------+ || | Data Files: base/<db_oid>/<rel_filenode> | pg_wal/00000001000000000000001 | || +-----------------------------------------------------------------------------+ |+-----------------------------------------------------------------------------------+1. Deconstructing EXPLAIN (ANALYZE, BUFFERS)
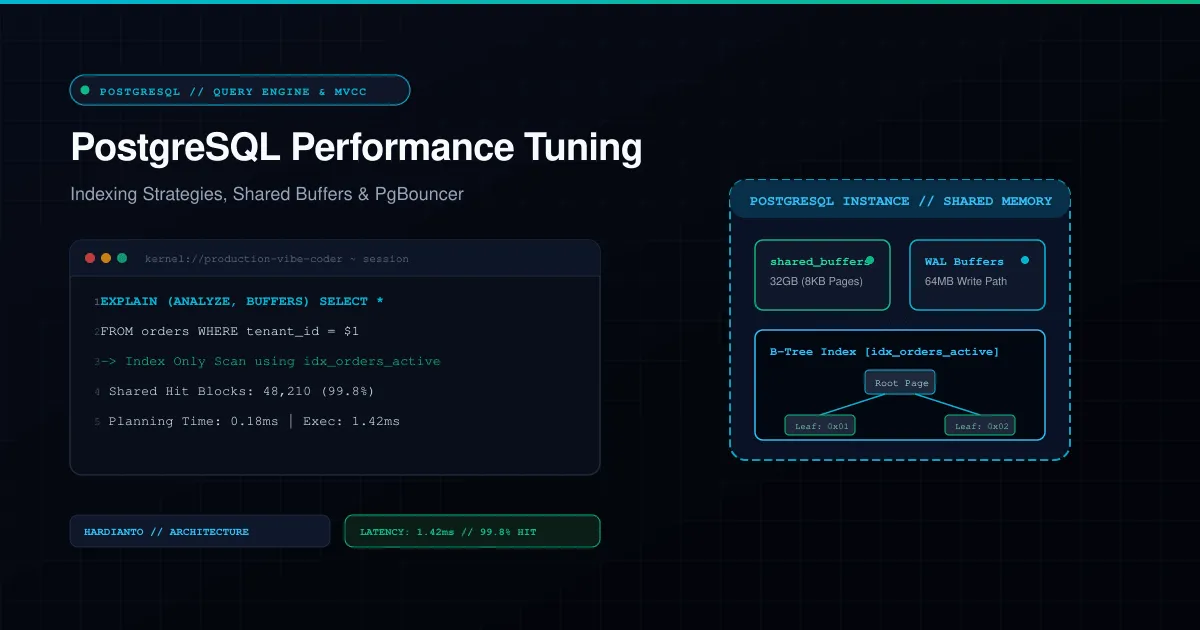
The standard EXPLAIN statement shows the query planner’s estimated cost based on table statistics in pg_statistic. However, running EXPLAIN (ANALYZE, BUFFERS) executes the query in a live sandbox, collecting precise runtime execution metrics and hardware cache hits.
-- Always use BUFFERS to assess physical disk I/O vs memory cache hitsEXPLAIN (ANALYZE, BUFFERS, TIMING, VERBOSE)SELECT o.id, o.customer_id, o.total_amount, o.created_atFROM orders oWHERE o.tenant_id = 'c4b81b6a-9f5a-4e38-9e56-11f84b6f7902' AND o.status = 'COMPLETED' AND o.created_at >= NOW() - INTERVAL '30 days'ORDER BY o.created_at DESCLIMIT 50;Reading the Query Plan Diagnostics
When analyzing the execution plan, prioritize the following indicators:
- Shared Hit vs Shared Read Blocks:
Shared Hit Blocks: Number of 8KB database blocks read directly from PostgreSQL’sshared_buffersin RAM (sub-microsecond access).Shared Read Blocks: Number of 8KB blocks that missedshared_buffersand forced an OS kernel read or physical disk I/O call (50–500 microseconds on NVMe, 2–10ms on rotational storage).
- Rows Removed by Filter:
- Indicates that PostgreSQL performed a broad scan (Sequential Scan or Bitmap Index Scan) and discarded millions of rows in memory because the index did not contain composite equality and range predicates.
- External Sort Spill:
- If
Sort Method: external merge Diskappears, your query exceededwork_mem, spilling temporary sort partitions to physical disk, causing extreme latency spikes.
- If
Tip (Production Rule: Buffers Beat Wall-Clock Time)
Never benchmark database optimization purely on wall-clock execution time. A query running against warm RAM cache may execute in 5ms during a test, but under peak load with cold cache, Shared Read Blocks will cause catastrophic latency degradation. Always optimize to minimize total blocks read.
2. Advanced Indexing: Choosing the Right Engine
PostgreSQL provides multiple specialized index data structures. Defaulting to standard B-Trees for every column is an anti-pattern.
| Index Engine | Best Suited Data Types | Query Operators Supported | Write Overhead | Storage Footprint |
|---|---|---|---|---|
| B-Tree | Scalar values (UUID, INT, VARCHAR, TIMESTAMP) | =, <, <=, >, >=, BETWEEN, IN | Moderate | High (every row indexed) |
| BRIN | Naturally sorted physical time-series / autoincrement | =, <, >, BETWEEN | Extremely Low | Minimal (0.5%–2% of table size) |
| GIN | JSONB keys, Arrays, Full-Text Search documents | @>, ?, `? | , ?&, @@` | High (on write/update) |
| GiST | Geometric coordinates, IP ranges, timestamps ranges | &&, @>, <@, ~= | Moderate to High | Moderate |
BRIN Indexes for Massive Time-Series Tables
Block Range Indexes (BRIN) do not index individual row tuples. Instead, they record the minimum and maximum values for physical block ranges on disk (by default, 128 pages = 1 megabyte).
-- For an event logging or audit table with 200,000,000 rows inserted sequentially:-- Standard B-Tree Size: ~6.2 Gigabytes-- BRIN Index Size: ~24 Megabytes (99.6% storage reduction!)
CREATE INDEX idx_audit_events_created_at_brinON audit_eventsUSING brin (created_at)WITH (pages_per_range = 64);Partial Indexes with Covering Columns (INCLUDE)
In modern multi-tenant software, most queries filter by tenant and active status. You can index only active records and include non-filtered columns to achieve an Index-Only Scan, bypassing heap table lookups entirely:
-- Covering Partial Index: Zero storage overhead for canceled/archived rowsCREATE INDEX idx_orders_active_lookupON orders (tenant_id, created_at DESC)INCLUDE (total_amount, customer_id)WHERE status = 'COMPLETED';3. Tuning the PostgreSQL Memory Engine
The default postgresql.conf shipped by most Linux distributions is conservative (often targeting 128MB shared buffers). In high-performance production workloads on modern cloud nodes (e.g., 32 vCPU, 128GB RAM), the configuration must be retuned:
# 1. Memory Configurationshared_buffers = 32GB # 25% of total host RAMeffective_cache_size = 96GB # 75% of total host RAM (includes OS page cache)maintenance_work_mem = 2GB # For VACUUM, CREATE INDEX, and ALTER TABLEwork_mem = 64MB # Per-operation sort/hash memory (allocate carefully)
# 2. Write-Ahead Log (WAL) & Checkpoint Throttlingwal_buffers = 64MB # Accommodate high concurrent transaction writesmin_wal_size = 4GBmax_wal_size = 32GB # Prevent excessive checkpoints under heavy write burstscheckpoint_completion_target = 0.9 # Spread I/O writes evenly across 90% of checkpoint intervalcheckpoint_timeout = 15min # Balance recovery time with sustained write throughput
# 3. Asynchronous Disk & Kernel Concurrencyrandom_page_cost = 1.1 # Optimized for modern NVMe SSDs (default 4.0 assumes HDDs)effective_io_concurrency = 200 # Enable asynchronous prefetching on POSIX AIOmax_worker_processes = 32 # Match available physical CPU coresmax_parallel_workers_per_gather = 4 # Max parallel workers per query nodemax_parallel_maintenance_workers = 4 # Parallel index buildsDanger (Warning: The work_mem Multiplication Hazard)
work_mem is not allocated per connection—it is allocated per sort, hash table, or group-by operation inside each query plan node. A single complex query with 4 joins and 2 sorts can consume 6 x work_mem. If 500 connections run this query concurrently with work_mem = 128MB, the engine will demand 384GB RAM, triggering the Linux Out-Of-Memory (OOM) Killer.
4. Connection Pooling Architecture: Why PgBouncer is Non-Negotiable
PostgreSQL employs a process-per-connection architecture (fork() model). Each client connection spawns a dedicated backend process consuming approximately 5MB to 10MB of overhead, while competing for lock manager slots and kernel CPU scheduling cycles.
Attempting to connect 2,000 microservice pods directly to a single PostgreSQL cluster will lead to catastrophic context switching degradation:
[1,500 Microservice Pods] | v (TCP Sockets)+------------------------------------+| PgBouncer Connection Pooler | --> Keeps 80 warm persistent connections| (Transaction Pooling Mode) |+------------------------------------+ | v (80 Dedicated Persistent Processes)+------------------------------------+| PostgreSQL Primary Instance | --> Peak CPU cache residency, minimal locks+------------------------------------+PgBouncer Configuration (pgbouncer.ini)
[databases]production_db = host=127.0.0.1 port=5432 dbname=app_production
[pgbouncer]listen_port = 6432listen_addr = *auth_type = scram-sha-256auth_file = /etc/pgbouncer/userlist.txt
# Transaction pooling delivers 10x throughput for stateless web applicationspool_mode = transaction
# Connection limitsmax_client_conn = 10000 # External client connections accepteddefault_pool_size = 80 # Actual connections maintained to PostgreSQLreserve_pool_size = 10reserve_pool_timeout = 3max_db_connections = 120
# Query timeouts to prevent hung transactionsserver_idle_timeout = 60query_timeout = 30client_idle_timeout = 1205. Controlling the MVCC Vacuum Lifecycle
PostgreSQL uses Multi-Version Concurrency Control (MVCC) to provide non-blocking concurrent reads and writes. When an existing row is updated or deleted, PostgreSQL does not overwrite data in place; it writes a new version (tuple) with updated xmax transaction identifiers.
Without aggressive autovacuuming, dead tuples accumulate, causing table bloat, degrading cache efficiency, and eventually triggering Transaction ID (XID) wraparound failure.
-- Tune aggressive autovacuuming on high-churn transaction tablesALTER TABLE user_sessions SET ( autovacuum_vacuum_scale_factor = 0.05, -- Trigger vacuum when 5% of rows are dead (default is 20%) autovacuum_vacuum_threshold = 1000, -- Minimum dead rows before triggering autovacuum_vacuum_cost_limit = 2000, -- Increase throughput budget for vacuum worker autovacuum_vacuum_cost_delay = 2 -- Sleep only 2ms when cost limit is hit);To monitor index bloat and vacuum efficacy in real time:
SELECT schemaname, relname, n_live_tup AS live_rows, n_dead_tup AS dead_rows, ROUND(n_dead_tup::NUMERIC / NULLIF(n_live_tup + n_dead_tup, 0) * 100, 2) AS dead_percentage, last_vacuum, last_autovacuumFROM pg_stat_user_tablesWHERE n_dead_tup > 10000ORDER BY dead_percentage DESCLIMIT 10;Key Takeaways for Production Engineering
- Verify Index Scans: Always verify that frequently run queries execute via
Index ScanorIndex Only Scan, and eliminateFilterdiscard steps. - Cap Work Memory: Restrict
work_memglobally and override it dynamically only in specific analytic batch sessions viaSET LOCAL work_mem = '512MB'. - Always Pool with PgBouncer: Never allow stateless application containers or serverless lambdas to open direct connections to the primary database; enforce transaction-level pooling.
- Tune Autovacuum Proactively: High-velocity tables require lowered scale factors to purge dead tuples before table bloat harms memory cache hit ratios.
Recommended for You
Explore more articles on similar topics and continue reading.
Zero-Downtime Database Migrations: The Expand-and-Contract Pattern in High-Volume Production
Production Kubernetes Hardening: Kernel Observability and Networking with eBPF & Cilium