
Beyond Syntactic Concurrency: What Powers the go Keyword?
To the programmer, spawning a concurrent lightweight execution thread in Go is as simple as typing go processTask(id). Underneath that two-letter keyword lies one of the most sophisticated runtime orchestrators in modern systems engineering.
Unlike operating system threads which demand 2MB to 8MB of fixed memory for their call stacks and require expensive kernel context switches (typically 1,000 to 1,500 CPU cycles), a Go routine (Goroutine) begins with a dynamic stack of merely 2,048 bytes (2KB). It is scheduled entirely in userspace with context switches taking fewer than 150 cycles.
Understanding how the Go runtime juggles millions of goroutines across physical CPU cores is critical when optimizing latency-sensitive distributed backends.
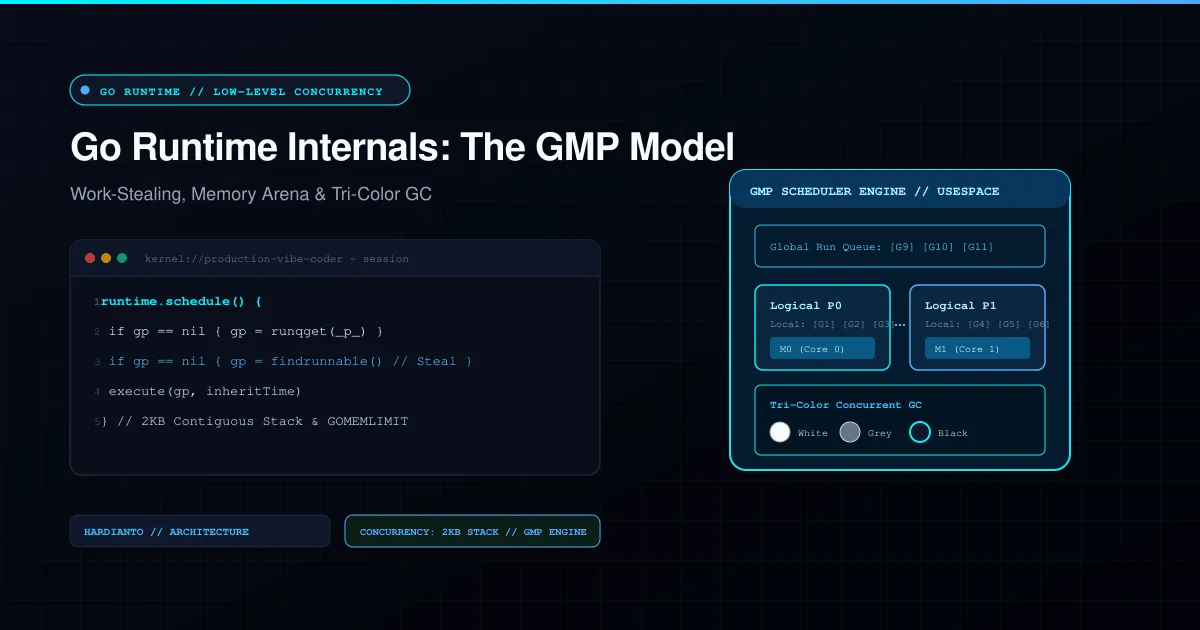
+------------------------------------------------------------------------------------+| THE GMP ARCHITECTURE |+------------------------------------------------------------------------------------+| || [Global Run Queue (GRQ)] -> Mutex locked, holds overflow Gs || || +--------------------------+ +--------------------------+ || | Processor (P0) | | Processor (P1) | || | Local Run Queue (LRQ) | | Local Run Queue (LRQ) | || | [G1] [G2] [G3] [G4] | | [G5] [G6] [G7] [G8] | || +--------------------------+ +--------------------------+ || | | || v binds to v binds to || +--------------------------+ +--------------------------+ || | OS Thread (M0) | | OS Thread (M1) | || | Running: [G_active] | | Running: [G_active] | || +--------------------------+ +--------------------------+ || | | |+---------------|--------------------------------------|-----------------------------+ v v [CPU Core 0] [CPU Core 1]1. The GMP Concurrency Model: G, M, and P
The runtime scheduler coordinates three distinct computational abstractions:
- G (Goroutine): Represents the goroutine. It encapsulates the dynamic execution stack, program counter (PC), CPU registers, and scheduling state (
_Gidle,_Grunnable,_Grunning,_Gwaiting). - M (Machine): Represents an actual operating system kernel thread created by the OS (
pthread). M executes machine code instructions on the physical CPU. - P (Processor): Represents a logical context or resource required to execute Go code. The number of
Pinstances matchesGOMAXPROCS(by default, the count of physical CPU cores on the system).
Work-Stealing Algorithm
To prevent contention on a single global queue, each logical processor P maintains its own Local Run Queue (LRQ) holding up to 256 goroutines without locks.
When an OS thread M finishes its local work, it follows this deterministic schedule search order:
- Check its own local
Pqueue. - Check the global run queue (
GRQ) every 61 ticks (to prevent starvation of global tasks). - Check the Network Poller (
epoll/kqueue) for non-blocking I/O wakeups. - Work-Stealing: If still empty, randomly choose another
Pand steal half of its run queue.
// Simplified conceptual representation of the Go runtime scheduler loop (src/runtime/proc.go)func schedule() { _g_ := getg()
var gp *g var inheritTime bool
// 1. Check global queue periodically to avoid starvation if _p_.schedtick%61 == 0 && sched.runqsize > 0 { lock(&sched.lock) gp = globrunqget(_p_, 1) unlock(&sched.lock) }
// 2. Pop from local run queue (lock-free) if gp == nil { gp, inheritTime = runqget(_p_) }
// 3. Steal work from other P's if gp == nil { gp, inheritTime = findrunnable() // Performs work-stealing & netpoller check }
// 4. Execute the Goroutine on current OS Thread (M) execute(gp, inheritTime)}2. Dynamic Stack Scaling: From 2KB to 1GB
Traditional C or Java threads allocate fixed stack frames. If a thread exceeds its allocated stack, a fatal stack overflow segmentation fault occurs. If it allocates 8MB but uses only 40KB, 99.5% of allocated memory is wasted.
Go solves this using Contiguous Stack Allocation:
[Stack Growth via Contiguous Allocation]
Initial (2KB Stack): +--------------------+ <-- SP (Stack Pointer) | Frame 1: main() | | Frame 2: worker() | +--------------------+ <-- Stack Limit Check
Stack Exceeded -> Runtime allocates 4KB contiguous memory block in Heap: +--------------------+ | Frame 1: main() | (Pointers adjusted) | Frame 2: worker() | | Frame 3: fetch() | | Frame 4: parse() | +--------------------+ <-- New Stack Limit (Old 2KB stack is reclaimed)At the prologue of every Go function, the compiler inserts a micro-check (called a stack check preamble). It compares the stack pointer register against the stack boundary limit. If exhausted, it calls runtime.morestack(), allocates a contiguous memory block twice the size, copies the old frames, updates internal pointers, and frees the old stack block.
Warning (Engineering Insight: Deep Recursion and Memory Spikes)
While contiguous stacks allow million-goroutine scaling, beware of deep call chains or accidental unbounded recursion. If 100,000 goroutines concurrently scale from 2KB to 64KB, your process memory footprint surges from 200MB to 6.4GB instantly.
3. Memory Allocation: The TCMalloc Lineage
Go bypasses the standard libc malloc() and implements a custom memory allocator derived from Google’s TCMalloc (Thread-Caching Malloc). It categorizes memory allocations into three distinct tiers:
- Tiny Allocations (< 16 Bytes): Packed together into a single 16-byte block to reduce internal fragmentation.
- Small Allocations (16 Bytes – 32KB): Divided into 67 distinct size classes. Managed by per-P thread caches (
mcache) without mutex locking. - Large Allocations (> 32KB): Allocated directly in continuous pages from
mheap.
[Logical Processor P] | v+------------------+| mcache | --> Thread-local cache (Zero locks, sub-nanosecond allocation)+------------------+ | Miss (Size class empty) v+------------------+| mcentral | --> Central cache partitioned by size class (Spanned lock)+------------------+ | Miss (No free pages) v+------------------+| mheap | --> Global heap managing memory in 8KB spans (Global lock)+------------------+ | Out of virtual address space v [mmap() / OS Virtual Memory]Escaping to the Heap: Escape Analysis
You can inspect the compiler’s escape analysis decisions using -gcflags="-m":
go build -gcflags="-m -m" main.goIf a variable’s reference outlives the stack frame of the function that created it (e.g., returning a pointer, passing to an interface method, or sending through an unbuffered channel), it escapes to the heap, creating garbage collection overhead:
// Example: Stack Allocation vs Heap Escapetype User struct { ID int64 Name string}
// Allocated on STACK (Zero GC pressure):func createUserStack() User { u := User{ID: 1, Name: "Developer"} return u // Value copy: stays on caller's stack frame}
// ESCAPES to HEAP (Adds to GC scan overhead):func createUserHeap() *User { u := User{ID: 2, Name: "Engineer"} return &u // Pointer returned: escapes function scope!}4. The Concurrent Tri-Color Mark-Sweep Garbage Collector
Go utilizes a concurrent, tri-color mark-and-sweep garbage collector designed to maintain Stop-The-World (STW) pauses below 1 millisecond.
[Initial Phase] [Concurrent Marking Phase] [Sweep Phase]
All Objects: Roots Scanned: Unreachable (White): (WHITE) (GREY) -> (BLACK) Reclaimed to mspan +---+ +---+ +---+ +---+ +---+ | A | | B | | A | -----> | B | | C | -> Free +---+ +---+ +---+ +---+ +---+ | | (BLACK) (GREY) v v +---+ +---+ +---+ | C | | D | | D | +---+ +---+ +---+ (BLACK)The runtime categorizes every object into one of three color states:
- White: Unvisited candidate for garbage collection.
- Grey: Visited, but references to other objects have not yet been evaluated.
- Black: Visited, and all reachable child references have been placed in the Grey set.
Write Barriers and Mutation Tracking
Because the Go GC runs concurrently with application code, application goroutines might break tri-color invariants by detaching a white object from a grey object and attaching it to a black object.
To prevent premature deletion of live objects, the Go compiler inserts a Hybrid Write Barrier. Whenever a pointer is modified during the marking phase, the write barrier intercepts the write and automatically recolors the target object to grey.
5. Modern GC Pacing: GOMEMLIMIT and GOGC
Prior to Go 1.19, developers struggled with container OOM crashes because Go’s GC trigger depended strictly on percentage growth (GOGC=100, which triggers GC when the heap doubles). In a container with 4GB RAM, if your base heap was 2.5GB, the GC would not trigger until 5GB, causing the Linux kernel to kill the process.
Today, production services should always configure GOMEMLIMIT:
# Production Docker / Kubernetes Environment Configuration:# Set GOMEMLIMIT to 85%–90% of your container's cgroup memory limitexport GOMEMLIMIT=3600MiBexport GOGC=100GOMEMLIMIT acts as a soft ceiling. When memory approaches this threshold, the GC automatically becomes more aggressive, reclaiming unused spans and running cycles more frequently to prevent OOM termination.
Performance Tuning Checklist
- Avoid Unnecessary Heap Escapes: Run
go build -gcflags="-m"and prefer value semantics over pointers for small structs. - Pre-Size Slices and Maps: Always pass capacity hints (
make([]T, 0, cap)) to prevent slice reallocations and memory copying. - Reuse Allocations with
sync.Pool: For high-frequency serialization buffers (JSON, Protobuf), reuse memory viasync.Pool. - Enforce
GOMEMLIMITin Containers: Prevent sudden OOM kills by declaring an explicit memory budget to the Go runtime.
Recommended for You
Explore more articles on similar topics and continue reading.
Programming Languages 2026: Memory Safety, Concurrency, and Type System Evolutions
PostgreSQL Performance Tuning at Scale: Indexing Strategies, Buffer Cache, and Connection Pooling