
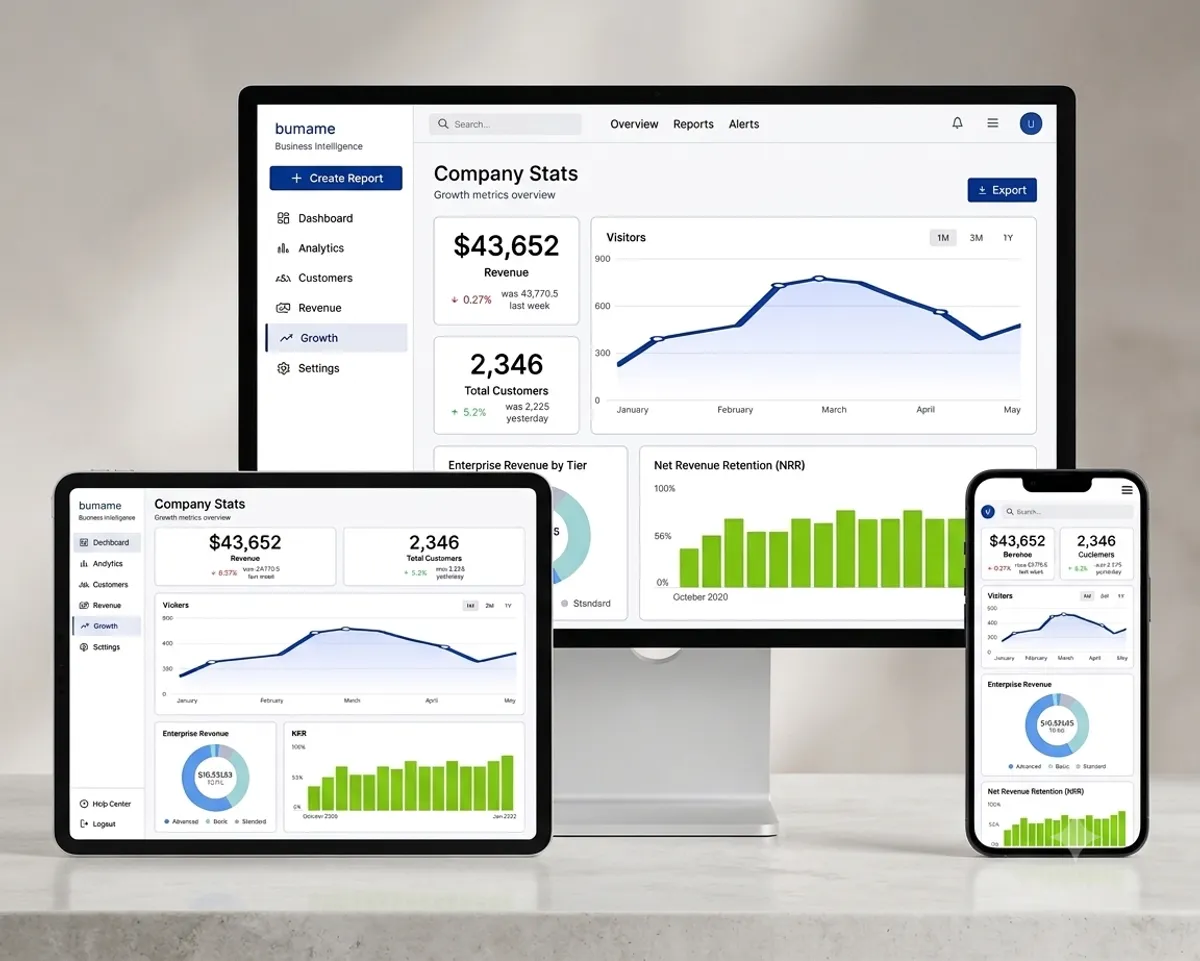
🏛️ System Overview & Engineering Highlights
The Business Intelligence Dashboard is an enterprise data intelligence platform engineered to eliminate operational data silos and deliver high-velocity analytics. The platform centralizes multi-channel operational streams into a unified high-speed analytical repository, combining automated ETL orchestration with predictive machine learning and automated financial auditing.
🎯 Key Technical Deliverables & Achievements
- Automated Data Ingestion: Engineered automated data ingestion and reporting workflows, accelerating strategic dashboard delivery by 45%.
- Unified Operational Repository: Consolidated fragmented operational records into a unified repository, boosting data retrieval speed by 40%.
- Predictive Demand Forecasting: Deployed automated demand forecasting models, increasing inventory planning accuracy by 60%.
- Real-Time Operational Monitoring: Implemented real-time operational monitoring and alert triggers, reducing incident response time by 35%.
- Automated Revenue Auditing: Designed automated revenue auditing workflows, improving anomaly and discrepancy detection by 50%.
🔬 Deep-Dive Technical Implementation
1. Ingestion Pipelines & Reporting Workflows
- Built resilient asynchronous ingestion pipelines connecting disparate POS, laboratory, and inventory systems into a centralized analytical lake.
- Eliminated manual data aggregation bottlenecks, accelerating executive-level dashboard hydration and delivery by 45%.
2. Unified Data Repository & Query Optimization
- Consolidated heterogeneous transactional datasets into an optimized relational & columnar architecture with PostgreSQL and BigQuery.
- Implemented partitioning, multi-column B-tree indexing, and materialized views, boosting data retrieval speed by 40% under high concurrency.
3. Machine Learning Demand Forecasting
- Integrated Python-based ML microservices with FastAPI for time-series demand estimation.
- Evaluated historical seasonality and lead-time variability, boosting stock and inventory planning accuracy by 60%.
4. Operational Telemetry & Alert Triggering
- Built an observer-pattern monitoring service tracking operational KPIs, system latency, and fulfillment queues.
- Configured automated multi-channel webhook and email alerts, reducing critical incident response times by 35%.
5. Automated Revenue & Financial Auditing
- Designed automated reconciliation routines comparing gateway settlements against operational ledger transactions.
- Automated anomaly and discrepancy detection by 50%, ensuring rigorous fiscal governance and auditable digital paper trails.
🛠 Technology Stack Matrix
| Domain | Technologies Used |
|---|---|
| Frontend & Visualization | Next.js 14 (App Router), TypeScript, Tailwind CSS, Recharts, D3.js |
| Backend & Analytics Services | Python (FastAPI), Node.js, Asynchronous Task Queues |
| Data Storage & Warehousing | PostgreSQL, Google BigQuery, Redis Distributed Caching |
| Data Pipelines & Modeling | Automated ETL Workflows, Time-Series Demand Forecasting (ML), Revenue Auditing |
📊 Performance Benchmarks & Impact
- +60% Forecasting Accuracy: ML-driven demand models for optimal supply chain readiness.
- +45% Accelerated Delivery: Automated ingestion pipelines delivering real-time dashboards to decision-makers.
- +50% Higher Anomaly Detection: Automated revenue reconciliation catching transaction discrepancies early.
- +40% Faster Query Retrieval: Indexed, unified data repository with sub-second response times.
- -35% Incident Response Time: Real-time operational monitoring and intelligent alert dispatch.